通过夜莺监控kube-scheduler
scheduler也提供了接口用于获取数据,端口为10259,走https协议,但是需要认证,如图:
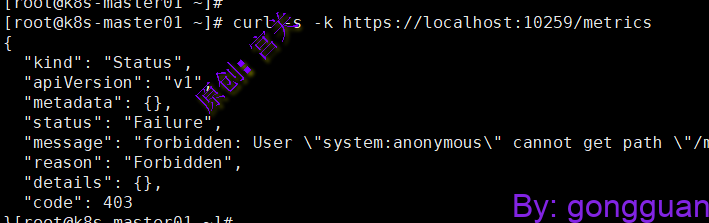
本例子中继续复用apiserver监控一章生成的token通过夜莺监控kube-apiserver – IT运维 (blog.ywdevops.cn)
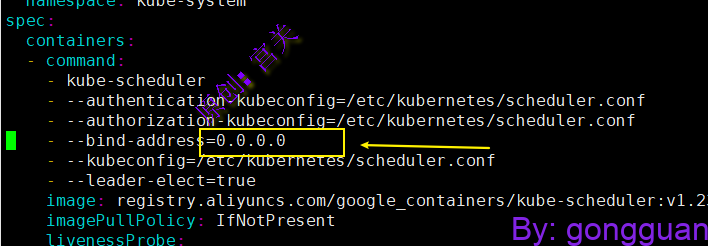
1、修改kube-scheduler配置文件,修改地址为0.0.0.0,如图:
2、修改prometheus.yaml文件,添加内容如下:
- job_name: 'kube_scheduler'
        kubernetes_sd_configs:
        - role: endpoints
        scheme: https
        tls_config:
          insecure_skip_verify: true
        authorization:
          credentials_file: /var/run/secrets/kubernetes.io/serviceaccount/token
        relabel_configs:
        - source_labels: [__meta_kubernetes_namespace, __meta_kubernetes_service_name, __meta_kubernetes_endpoint_port_name]
          action: keep
          regex: kube-system;kube-scheduler;https
上面标签中的service name不存在,因此需要单独创建,执行如下:
apiVersion: v1
kind: Service
metadata:
  namespace: kube-system
  name: kube-scheduler
  labels:
    k8s-app: kube-scheduler
spec:
  selector:
    component: kube-scheduler
  type: ClusterIP
  clusterIP: None
  ports:
  - name: https
    port: 10259
    targetPort: 10259
    protocol: TCP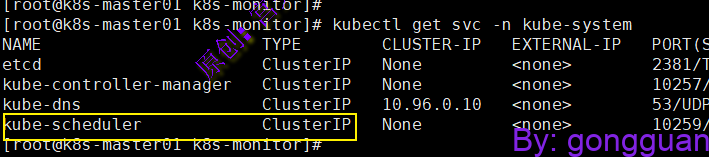
3、执行资源文件prometheus.yml,并重启prometheus agent pod,如下:
kubectl apply -f prometheus.yml
kubectl rollout restart deploy prometheus-agent -n monitor
4、通过夜莺服务端页面即时查询指标,如图:
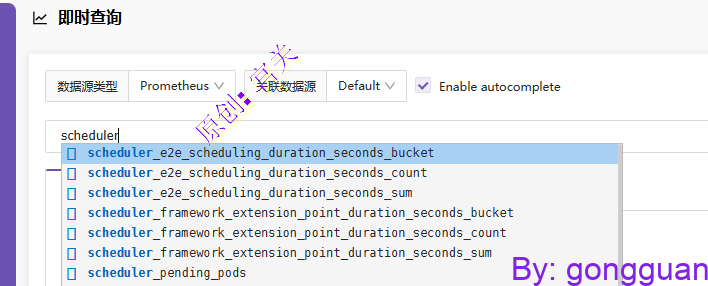
关键指标如下:
# HELP rest_client_request_duration_seconds [ALPHA] Request latency in seconds. Broken down by verb and URL.
# TYPE rest_client_request_duration_seconds histogram
请求apiserver的延迟分布

# HELP rest_client_requests_total [ALPHA] Number of HTTP requests, partitioned by status code, method, and host.
# TYPE rest_client_requests_total counter
请求apiserver的总数 ,按照host code method 统计

# HELP leader_election_master_status [ALPHA] Gauge of if the reporting system is master of the relevant lease, 0 indicates backup, 1 indicates master. 'name' is the string used to identify the lease. Please make sure to group by name.
# TYPE leader_election_master_status gauge
调度器的选举状态,0表示backup, 1表示master

# HELP scheduler_queue_incoming_pods_total [STABLE] Number of pods added to scheduling queues by event and queue type.
# TYPE scheduler_queue_incoming_pods_total counter
进入调度队列的pod数

# HELP scheduler_preemption_attempts_total [STABLE] Total preemption attempts in the cluster till now
# TYPE scheduler_preemption_attempts_total counter
调度器驱逐容器的次数

# HELP scheduler_scheduler_cache_size [ALPHA] Number of nodes, pods, and assumed (bound) pods in the scheduler cache.
# TYPE scheduler_scheduler_cache_size gauge
调度器cache中node pod和绑定pod的数目

# HELP scheduler_pending_pods [STABLE] Number of pending pods, by the queue type. 'active' means number of pods in activeQ; 'backoff' means number of pods in backoffQ; 'unschedulable' means number of pods in unschedulableQ.
# TYPE scheduler_pending_pods gauge
调度pending的pod数量,按照queue type分别统计

# HELP scheduler_plugin_execution_duration_seconds [ALPHA] Duration for running a plugin at a specific extension point.
# TYPE scheduler_plugin_execution_duration_seconds histogram
调度插件在每个扩展点的执行时间,按照extension_point+plugin+status 分别统计

# HELP scheduler_e2e_scheduling_duration_seconds [ALPHA] (Deprecated since 1.23.0) E2e scheduling latency in seconds (scheduling algorithm + binding). This metric is replaced by scheduling_attempt_duration_seconds.
# TYPE scheduler_e2e_scheduling_duration_seconds histogram
调度延迟分布,1.23.0 以后会被scheduling_attempt_duration_seconds替代

# HELP scheduler_framework_extension_point_duration_seconds [STABLE] Latency for running all plugins of a specific extension point.
# TYPE scheduler_framework_extension_point_duration_seconds histogram
调度框架的扩展点延迟分布,按extension_point(扩展点Bind Filter Permit PreBind/PostBind PreFilter/PostFilter Reseve)
+profile(调度器)+ status(调度成功) 统计

# HELP scheduler_pod_scheduling_attempts [STABLE] Number of attempts to successfully schedule a pod.
# TYPE scheduler_pod_scheduling_attempts histogram
pod调度成功前,调度重试的次数分布

# HELP scheduler_schedule_attempts_total [STABLE] Number of attempts to schedule pods, by the result. 'unschedulable' means a pod could not be scheduled, while 'error' means an internal scheduler problem.
# TYPE scheduler_schedule_attempts_total counter
按照调度结果统计的调度重试次数。 "unschedulable" 表示无法调度,"error"表示调度器内部错误

# HELP scheduler_scheduler_goroutines [ALPHA] Number of running goroutines split by the work they do such as binding.
# TYPE scheduler_scheduler_goroutines gauge
按照功能(binding filter之类)统计的goroutine数量

# HELP scheduler_scheduling_algorithm_duration_seconds [ALPHA] Scheduling algorithm latency in seconds
# TYPE scheduler_scheduling_algorithm_duration_seconds histogram
调度算法的耗时分布

# HELP scheduler_scheduling_attempt_duration_seconds [STABLE] Scheduling attempt latency in seconds (scheduling algorithm + binding)
# TYPE scheduler_scheduling_attempt_duration_seconds histogram
调度算法+binding的耗时分布

# HELP scheduler_scheduler_goroutines [ALPHA] Number of running goroutines split by the work they do such as binding.
# TYPE scheduler_scheduler_goroutines gauge
调度器的goroutines数目