通过categrfa监控kube-proxy
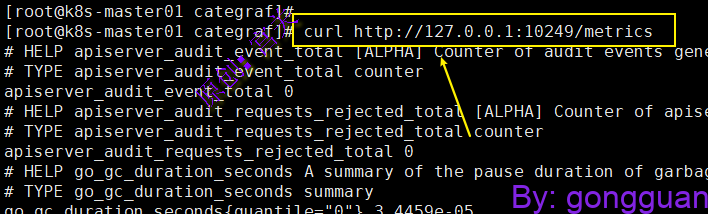
Kube-Proxy 默认暴露两个端口,10249用于暴露监控指标,在/metrics接口获取遵循Prometheus协议的监控数据,如图:
10256端口用来检查kube-proxy的健康状态,通过接口/healthz来检查,如图:

1、配置categraf中的prometheus插件,如下:
vim conf/input.prometheus/prometheus.yml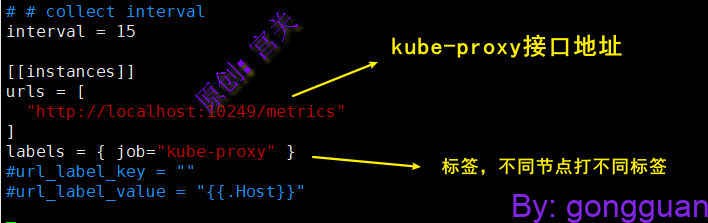
2、重启categraf,查看监控指标,如图:
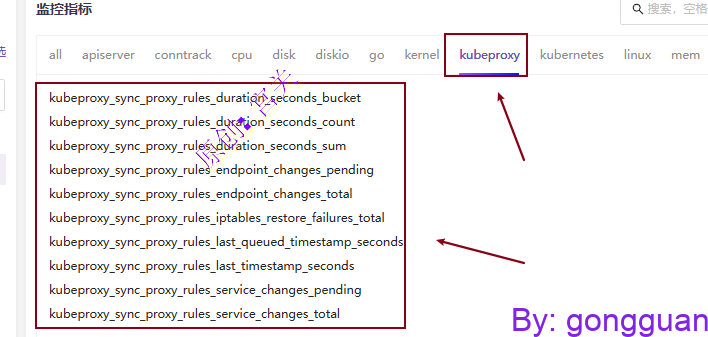
通过如下命令也可以测试监控指标是否存在:
./categraf --test --inputs prometheus | grep kubeproxy_sync_proxy_rules上述二进制部署方式有个问题就是有几个节点,就要去分别修改categraf的配置,如果后期扩容节点,也要一个个修改,略微麻烦,还有一种办法就是将categraf做成Daemonset,这样无需担心扩容后手动修改的问题
Daemonset方式部署categraf
kube-proxy检测关键指标:
# HELP go_gc_duration_seconds A summary of the pause duration of garbage collection cycles.
# TYPE go_gc_duration_seconds summary
gc时间

# HELP go_goroutines Number of goroutines that currently exist.
# TYPE go_goroutines gauge
goroutine数量

# HELP go_threads Number of OS threads created.
# TYPE go_threads gauge
线程数量

# HELP kubeproxy_network_programming_duration_seconds [ALPHA] In Cluster Network Programming Latency in seconds
# TYPE kubeproxy_network_programming_duration_seconds histogram
service或者pod发生变化到kube-proxy规则同步完成时间指标含义较复杂,参照https://github.com/kubernetes/community/blob/master/sig-scalability/slos/network_programming_latency.md

# HELP kubeproxy_sync_proxy_rules_duration_seconds [ALPHA] SyncProxyRules latency in seconds
# TYPE kubeproxy_sync_proxy_rules_duration_seconds histogram
规则同步耗时

# HELP kubeproxy_sync_proxy_rules_endpoint_changes_pending [ALPHA] Pending proxy rules Endpoint changes
# TYPE kubeproxy_sync_proxy_rules_endpoint_changes_pending gauge
endpoint 发生变化后规则同步pending的次数

# HELP kubeproxy_sync_proxy_rules_endpoint_changes_total [ALPHA] Cumulative proxy rules Endpoint changes
# TYPE kubeproxy_sync_proxy_rules_endpoint_changes_total counter
endpoint 发生变化后规则同步的总次数

# HELP kubeproxy_sync_proxy_rules_iptables_restore_failures_total [ALPHA] Cumulative proxy iptables restore failures
# TYPE kubeproxy_sync_proxy_rules_iptables_restore_failures_total counter
本机上 iptables restore 失败的总次数

# HELP kubeproxy_sync_proxy_rules_last_queued_timestamp_seconds [ALPHA] The last time a sync of proxy rules was queued
# TYPE kubeproxy_sync_proxy_rules_last_queued_timestamp_seconds gauge
最近一次规则同步的请求时间戳,如果比下一个指标 kubeproxy_sync_proxy_rules_last_timestamp_seconds 大很多,那说明同步 hung 住了

# HELP kubeproxy_sync_proxy_rules_last_timestamp_seconds [ALPHA] The last time proxy rules were successfully synced
# TYPE kubeproxy_sync_proxy_rules_last_timestamp_seconds gauge
最近一次规则同步的完成时间戳

# HELP kubeproxy_sync_proxy_rules_service_changes_pending [ALPHA] Pending proxy rules Service changes
# TYPE kubeproxy_sync_proxy_rules_service_changes_pending gauge
service变化引起的规则同步pending数量

# HELP kubeproxy_sync_proxy_rules_service_changes_total [ALPHA] Cumulative proxy rules Service changes
# TYPE kubeproxy_sync_proxy_rules_service_changes_total counter
service变化引起的规则同步总数

# HELP process_cpu_seconds_total Total user and system CPU time spent in seconds.
# TYPE process_cpu_seconds_total counter
利用这个指标统计cpu使用率

# HELP process_max_fds Maximum number of open file descriptors.
# TYPE process_max_fds gauge
进程可以打开的最大fd数

# HELP process_open_fds Number of open file descriptors.
# TYPE process_open_fds gauge
进程当前打开的fd数

# HELP process_resident_memory_bytes Resident memory size in bytes.
# TYPE process_resident_memory_bytes gauge
统计内存使用大小

# HELP process_start_time_seconds Start time of the process since unix epoch in seconds.
# TYPE process_start_time_seconds gauge
进程启动时间戳

# HELP rest_client_request_duration_seconds [ALPHA] Request latency in seconds. Broken down by verb and URL.
# TYPE rest_client_request_duration_seconds histogram
请求 apiserver 的耗时(按照url和verb统计)

# HELP rest_client_requests_total [ALPHA] Number of HTTP requests, partitioned by status code, method, and host.
# TYPE rest_client_requests_total counter
请求 apiserver 的总数(按照code method host统计)